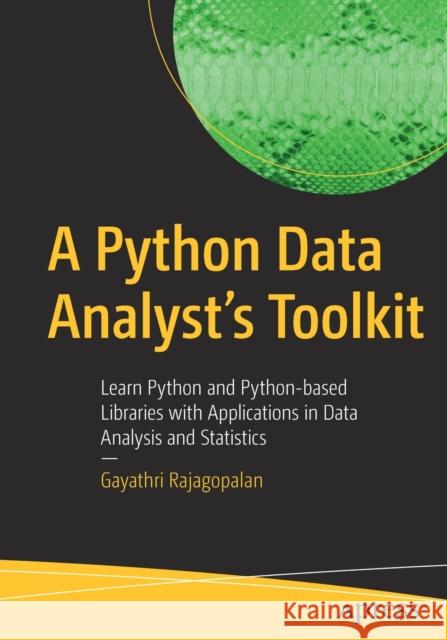
"It is very well designed for beginners and guides them step by step towards autonomy in using Python. ... this book is a good pedagogic tool for those starting to use Python for data analysis, with practical applications and with some review exercises at the end of each chapter. For anyone who wants to start with Python without any knowledge in programming, this book is a good companion and can help the reader to quickly become confident in using Python." (Sébastien Bailly, ISCB News, iscb.info, Vol. 72, December, 2021)
Chapter 1: Introduction to Python [25 pages]
Description: Python is one of the most popular open-source programming languages and is easy to learn as well.
Topics to be covered:
1. Installation – how to install Python and Anaconda
2. Using Jupyter notebooks
3. Data types in Python
4. Loops and conditional statements
5. Functions
6. Strings and their methods
7. PEP(Python Enhancement Proposal) guidelines
8. Sympy library and solving mathematical problems with Python
Chapter 2: Exploring Containers, Classes & Objects, and Working with Files [25 pages]
Description: Understanding data structures, classes and objects and file handling in Python.
Topics to be covered:
1. Lists
2. Tuples
3. Dictionaries
4. Sets
5. Classes and Objects
6. Working with files
Chapter 3: Regular Expressions [20 pages]
Description: Regular expressions are important to understand as they have a wide range of applications, from natural language processing to working with files to manipulating strings
Topics to be covered:
1. Introduction to regular expressions
2. Meta-characters
3. Python functions for regular expressions
4. Matching characters and sub-expressions
5. Using conditions for matching
Chapter 4: Data Analysis Basics [10 pages]
Description: In this chapter, we will cover the basic terminology in data analysis and the data analysis workflow
Topics to be covered:
1. Basic concepts and definitions
2. Levels of data
3. Data analysis workflow
Chapter 5: Numpy Library [10 pages]
Description: The Numpy library will be explained in detail.
Topics to be covered:
1. Introduction
2. Creating arrays
3. Slicing and dicing
4. Array manipulations
Chapter 6: Data Wrangling with Pandas [50 pages]
Description: Everything related to Pandas, a widely used library used for manipulating and analyzing data
Topics to be covered:
1. Introduction
2. Series and their methods/functions
3. DataFrames and their methods/functions
4. Grouping and Aggregation
5. Merging objects
6. Tidying data
Chapter 7: Data Visualization [20 pages]
Description: An introduction to data visualization, which is crucial for and conveying insights to a new audience
Topics to be covered:
1. Introduction
2. Types of plots
3. Creating plots with the Matplotlib library
4. Using the Pandas library for drawing graphs
5. Visualization with the Seaborn library
Chapter 8: Case Studies [60 pages]
Each case study will start with an overview of the dataset, followed by an in-depth analysis of data that includes data tidying, wrangling, and visualization. The case study would conclude with crucial insights, and recommendations.
1. Titanic survivors case study
2. Analyzing unstructured data using a Wikipedia web page
3. New Delhi Air Pollution case study
Chapter 9: Essentials of Statistics [60 pages]
Description: Knowledge of statistics and its applications, is essential for a data analyst or scientist, and this chapter will try to provide an accessible introduction to what is considered a complicated and confusing subject.
Topics to be covered:
1. Introduction
2. Basic terms
3. Measures of central tendency
4. Probability
5. Distributions
6. Bayes Theorem
7. Central Limit Theorem
8. Hypothesis testing
Gayathri Rajagopalan works for a leading Indian multi-national organization, with ten years of experience in the software and information technology industry. A computer engineer and a certified Project Management Professional (PMP), some of her key focus areas include Python, data analytics, machine learning, and deep learning. She is proficient in Python, Java, and C/C++ programming. Her hobbies include reading, music, and teaching data science to beginners.
Explore the fundamentals of data analysis, and statistics with case studies using Python. This book will show you how to confidently write code in Python, and use various Python libraries and functions for analyzing any dataset. The code is presented in Jupyter notebooks that can further be adapted and extended.
This book is divided into three parts – programming with Python, data analysis and visualization, and statistics. You'll start with an introduction to Python – the syntax, functions, conditional statements, data types, and different types of containers. You'll then review more advanced concepts like regular expressions, handling of files, and solving mathematical problems with Python.
The second part of the book, will cover Python libraries used for data analysis. There will be an introductory chapter covering basic concepts and terminology, and one chapter each on NumPy(the scientific computation library), Pandas (the data wrangling library) and visualization libraries like Matplotlib and Seaborn. Case studies will be included as examples to help readers understand some real-world applications of data analysis.
The final chapters of book focus on statistics, elucidating important principles in statistics that are relevant to data science. These topics include probability, Bayes theorem, permutations and combinations, and hypothesis testing (ANOVA, Chi-squared test, z-test, and t-test), and how the Scipy library enables simplification of tedious calculations involved in statistics.
You will:
Further your programming and analytical skills with Python
Solve mathematical problems in calculus, and set theory and algebra with Python
Work with various libraries in Python to structure, analyze, and visualize data
Tackle real-life case studies using Python
Review essential statistical concepts and use the Scipy library to solve problems in statistics