topmenu


Katz, Josh
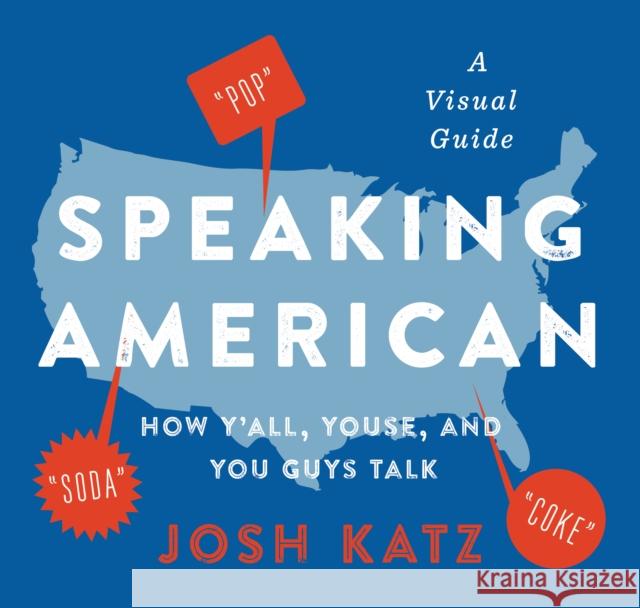
JOSH KATZ is a graduate of the North Carolina State University Department of Statistics. His passion for data visualization as a research communication tool led him to develop the statistical algorithm underlying these maps. In 2014 Josh began in his role as a graphics editor with the New York Times, where he has worked on some of that organization s most innovative and engaging content, like the viral New York Times dialect quiz and maps.


Czytaj nas na:
Zobacz: Księgarnia Czeska | Wydawnictwo Książkowe Klimaty | Mapa strony | Lista autorów
KrainaKsiazek.PL - Księgarnia Internetowa

KrainaKsiazek.PL - Księgarnia Internetowa

