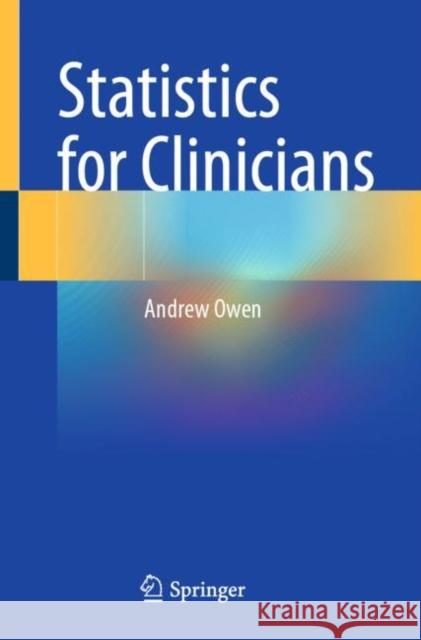
Statistics for Clinicians » książka


(netto: 230,00 VAT: 5%)
Najniższa cena z 30 dni: 231,29
ok. 22 dni roboczych.
Darmowa dostawa!
1.1 The phases of clinical trials
1.2 Randomised controlled trials
1.2.1 Randomisation
1.2.2 Minimisation
1.2.3 Blinding
1.2.4 Randomised controlled trials
1.2.5 Example 1.1
1.3 Observational studies
1.3.1 The case control study
1.3.2 The cohort study
1.3.3 Example 1.2
1.4 Types of data
1.5 Mean, median and variance
1.5.1 Continuous data
1.5.2 Ordinal data
1.6 Probability
1.7 The Normal distribution
1.8 The standard error of the mean
1.9 The t-distribution
1.10 The Binomial distribution
1.11 The Poisson distribution
2 Hypothesis testing and p-values
2.1 The t-test
2.2 The difference in two proportions
2.2.1 The number needed to treat
2.3 The Chi square test
2.4 Paired proportions, McNemar’s test
2.5 Ratio Statistics
2.6 Understanding p-values
2.7 Sample size determination
2.8 Two sided or one sided tests
2.8.1 Example 1.1 (continued)
2.9 Non Inferiority Trials
2.9.1 The choice of the non inferiority margin
2.9.2 Example 2.1
2.9.3 Example 2.2
2.10 Non parametric tests
2.11 Analysing questionnaire data
3 Regression
3.1 Univariate regression
3.2 Multivariate regression
3.3 Logistic regression
3.3.1 Example 1.2 (continued)
3.4 Multinomial regression
3.5 Ordinal regression
3.5.1 Example 3.1
3.6 Poisson regression
3.6.1 Example 3.2
3.6.2 Example 1.1 continued
3.7 Correlation
3.8 Analysis of variance (ANOVA)
3.8.1 Repeated measures ANOVA
3.8.2 Example 3.1 continued
4 Survival analysis
4.1 Overview of survival trials
4.1.1 Patient inclusion and exclusion criteria
4.1.2 Trial outcomes
4.1.3 Sample size determination
4.1.4 Stopping rules for survival trials
4.1.5 Intention to treat and as treated analyses
4.2 The Kaplan-Meier survival Curve
4.3 Cox regression
4.3.1 Example 4.1
4.3.2 Example 4.2
4.3.3 Example 4.3
4.4 The logrank test
4.5 Composite outcomes
4.5.1 Example 4.4
4.5.2 The Win ratio
4.5.3 Example 4.5
4.6 Competing events
4.6.1 Example 4.6
4.7 The cumulative incidence function (CIF) for survival analysis with competing events
4.8 Hazard functions for survival analysis with competing events
4.8.1 The cause specific hazard
4.8.2 The subdistributional hazard
4.8.3 Relationship between hazard ratios
4.8.4 Example 4.6 (continued)
4.9 Composite endpoints in the presence of competing events
4.9.1 Example 4.7
4.9.2 Example 4.8
4.9.3 Example 4.9
4.9.4 Example 4.10
4.9.5 Commentary on Examples 4.8 to 4.10
4.10 Summary of competing events
4.11 The proportional hazards assumption
4.11.1 Example 4.11
4.12 Mean survival time
4.12.1 Example 4.1 (continued)
4.12.2 Example 4.12
4.12.3 Example 4.13
4.13 Survival analysis and observational data
4.14 Clinical prediction models
4.14.1 Basic principles of clinical prediction models
4.14.2 Example 4.14
4.14.3 Example 4.15
4.14.4 Summary of clinical prediction models
5 Bayesian statistics
5.1 Bayes theorem
5.2 Credible and confidence intervals
5.3 Bayesian analysis of clinical trials
5.3.1 Example 5.1
5.3.2 Example 5.2
5.3.3 Example 5.3
5.3.4 Example 5.4
5.4 Choice of prior
5.5 Bayesian analysis of non inferiority trials
5.5.1 Example 2.1 continued
5.6 Summary of the Bayesian approach
6 Diagnostic tests
6.1 The accuracy of diagnostic tests
6.1.1 Comparison of diagnostic tests
6.2 Use of diagnostic tests for patient care
6.2.1 Bayes theorem applied to diagnostic tests
6.3 Clinical application of Bayes theorem for diagnostic tests
6.4 Examples of selecting a diagnostic test
6.4.1 Acute pulmonary embolism
6.4.2 Suspected coronary artery disease
6.5 Summary of diagnostic testing in clinical practice
6.6 The ROC curve
6.7 The c-statistic for diagnostic tests
7 Meta analysis
7.1 Systemic review of trial evidence
7.2 Fixed and random effects meta analyses
7.3 Heterogeneity
7.4 The Forest plot
7.5 Publication bias
7.6 The funnel plot
7.7 Reliability of meta analyses
7.7.1 Sensitivity analysis
7.8 Interpretation of meta analyses
7.8.1 Example 7.1
7.8.2 Summary
7.9 Meta regression
7.9.1 Example 7.2
7.10 Bayesian meta analysis
7.10.1 Bayesian fixed and random effects analysis
7.10.2 Example 7.3
7.10.3 Example 7.1 (continued)
7.10.4 Example 7.4
7.10.5 Summary
7.10.6 Bayesian meta regression
7.11 Network meta analysis
7.11.1 Example 7.5
7.11.2 Example 7.6
7.12 Meta analyses using patient level data
8 Appendix
8.1 Equations
8.2 Graphs
8.3 Indices
8.4 The logarithm
Dr Owen is an Emeritus Fellow of the European Society of Cardiology and has been a consultant cardiologist for 30 years. Prior to training in medicine he studied mathematics (B.Sc., PhD). He has been chairman of a local Research Ethics Committee and has studied Statistics leading to an M.Sc. in Applied Statistics. He has previously taught on an M.Sc. in Cardiology for medical graduates including giving lectures on statistics.
This book provides clinical medicine readers with a detailed explanation of statistical concepts using non-technical terms. This allows clinicians and others without specialist statistical knowledge to understand the medical literature where such concepts are used. Many examples from the medical literature are used to exemplify how these concepts are used in practice.
Current books written for clinicians fall into two broad categories. Simple texts that are not designed to cover many important statistical concepts used in the medical literature. Comprehensive texts which cover many statistical principles in detail, including statistical theory, but which are more challenging to read and do not always cover many important statistical techniques used in the medical literature. This book assists in the understanding of these techniques.
Statistics for Clinicians covers such topics in a robust non-technical manner accessible to clinicians and is intended for hospital consultants, junior doctors and general practitioners. Undergraduates in biomedical sciences and medicine may also find some sections valuable.
1997-2026 DolnySlask.com Agencja Internetowa
KrainaKsiazek.PL - Księgarnia Internetowa


