Part 1 - Basic knowledge and tools to apply statistics.- Statistics is fun.- Excel: A brief introduction and the statistical possibilities.- Part 2 - Describe, nothing but describe.- Mean values: How people and objects behave on average.- Scatter: The deviation from average behavior.- Graphs: The possibility to represent data visually.- Correlation: Of the correlation.- Ratio and index numbers: The chance to generate new things from old knowledge.- Part 3 - From Few to All.- Of Data and the Truth.- Hypotheses: Just a specification of the question.- Normal distribution and other test distributions.- Hypothesis testing: What is Valid?.- Part 4 - Procedures for Testing Hypotheses.- The Mean Test.- The Test for Difference of Means in Independent Samples.- The Test for Difference of Means in Dependent Samples.- The Analysis of Variance for Testing for Group Differences in More than Two Groups.- The Test for Correlation in Metric, Ordinal, and Nominal Data.- Further Test Procedures for Nominal Variables.- Summary Part IV - Overview of testing procedures.- Part 5 - Regression analysis.- The linear single regression.- The multiple regression analysis.- Part 6 - What's next.- Brief report on a research question.- Further statistical procedures.- Interesting and further statistics books.- Another data set to practice on - Intern of a company.- Appendix.
Prof. Dr. Franz Kronthaler is professor of economics and statistics at the University of Applied Sciences Graubünden FHGR. He has been working as an empirical economic researcher for more than 20 years, has conducted numerous research projects and published papers. For many years, he has been teaching students of various disciplines in applied statistics and the advanced methods of data analysis at Bachelor and Master level.
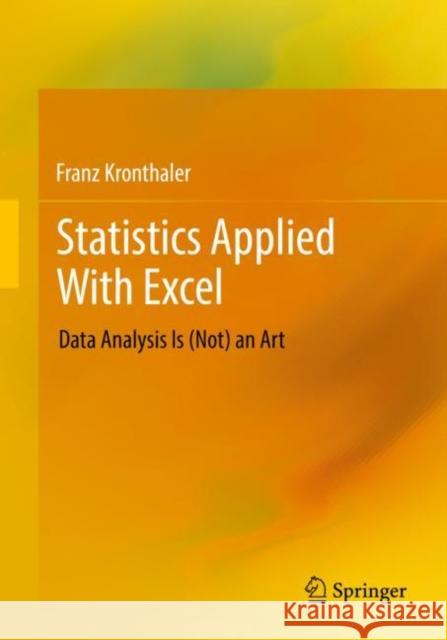
This book shows you how to analyze data sets systematically and to use Excel 2019 to extract information from data almost effortlessly. Both are (not) an art!
The statistical methods are presented and discussed using a single data set. This makes it clear how the methods build on each other and gradually more and more information can be extracted from the data. The Excel functions used are explained in detail - the procedure can therefore be easily transferred to other data sets.
Various didactic elements facilitate orientation and working with the book: At the checkpoints, the most important aspects from each chapter are briefly summarized. In the freak knowledge section, more advanced aspects are addressed to whet the appetite for more. All examples are calculated with hand and Excel. Numerous applications and solutions as well as further data sets are available on the author's internet platform.
This book is a translation of the original German 2nd edition Statistik angewandt mit Excel by Franz Kronthaler, published by Springer-Verlag GmbH Germany, part of Springer Nature in 2021. The translation was done with the help of artificial intelligence (machine translation by the service DeepL.com). A subsequent human revision was done primarily in terms of content, so that the book will read stylistically differently from a conventional translation. Springer Nature works continuously to further the development of tools for the production of books and on the related technologies to support the authors.
The Author
Prof. Dr. Franz Kronthaler is professor of economics and statistics at the University of Applied Sciences Graubünden FHGR. He has been working as an empirical economic researcher for more than 20 years, has conducted numerous research projects and published papers. For many years, he has been teaching students of various disciplines in applied statistics and the advanced methods of data analysis at Bachelor and Master level.