Quantitative Analysis and Ibm(r) Spss(r) Statistics: A Guide for Business and Finance » książka
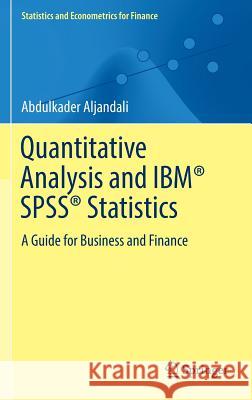
Quantitative Analysis and Ibm(r) Spss(r) Statistics: A Guide for Business and Finance
ISBN-13: 9783319455273 / Angielski / Twarda / 2016 / 184 str.
This guide is for practicing statisticians and data scientists who use IBM SPSS for statistical analysis of big data in business and finance. This is the first of a two-part guide to SPSS for Windows, introducing data entry into SPSS, along with elementary statistical and graphical methods for summarizing and presenting data. Part I also covers the rudiments of hypothesis testing and business forecasting while Part II will present multivariate statistical methods, more advanced forecasting methods, and multivariate methods. IBM SPSS Statistics offers a powerful set of statistical and information analysis systems that run on a wide variety of personal computers. The software is built around routines that have been developed, tested, and widely used for more than 20 years. As such, IBM SPSS Statistics is extensively used in industry, commerce, banking, local and national governments, and education. Just a small subset of users of the package include the major clearing banks, the BBC, British Gas, British Airways, British Telecom, the Consumer Association, Eurotunnel, GSK, TfL, the NHS, Shell, Unilever, and W.H.S. Although the emphasis in this guide is on applications of IBM SPSS Statistics, there is a need for users to be aware of the statistical assumptions and rationales underpinning correct and meaningful application of the techniques available in the package; therefore, such assumptions are discussed, and methods of assessing their validity are described. Also presented is the logic underlying the computation of the more commonly used test statistics in the area of hypothesis testing. Mathematical background is kept to a minimum.


