Monitoring Cloud-Native Applications: Lead Agile Operations Confidently Using Open Source Software » książka


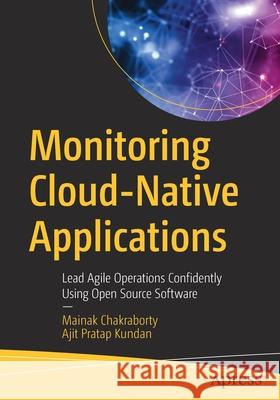
Monitoring Cloud-Native Applications: Lead Agile Operations Confidently Using Open Source Software
ISBN-13: 9781484268872 / Angielski / Miękka / 2021 / 245 str.
Monitoring Cloud-Native Applications: Lead Agile Operations Confidently Using Open Source Software
ISBN-13: 9781484268872 / Angielski / Miękka / 2021 / 245 str.
(netto: 288,19 VAT: 5%)
Najniższa cena z 30 dni: 289,13
ok. 16-18 dni roboczych.
Darmowa dostawa!
Part I: Introduction to Monitoring
Chapter 1: Basic concepts of Monitoring
Chapter Goal: This chapter is about the foundational concepts of monitoring and the associated terminology. It starts with explaining why monitoring is important and also discusses the parameters which can be monitored. We will take a look at the different ways in which monitoring can be done —some systems generate data continuously and others produce data when some event happens. It is most useful for identifying and investigating problems within your systems.
No of pages: 20 Pages
Sub -Topics:
1. Overview of Monitoring Concepts
2. Proactive and Reactive Monitoring
3. Importance of Observability
4. What to Monitor – Infrastructure, Application and Services
5. Advanced Monitoring of Business KPIs and User Experience
Chapter 2: Collection of Events, Logs and Metrics
Chapter Goal: This chapter will explain the difference between Events, Logs and Metrics. It also goes into the details of collection of telemetry from Work Metric and Resource Metric. We will take a look at which data to collect and how to collect that data.
No of pages: 40 Pages
Sub - Topics1. Granularity and Resolution – observations at fixed time interval
2. Types of Metrics – Histograms, Gauges, Counters and Timers
3. Statistical functions – Count, Sum, Average etc.
4. Work Metric – Throughput, Success, Error, Performance
5. Resource Metric – Utilization, Saturation, Errors, Availability
6. Introduction to Telegraf, collectd, statd
Chapter 3: Architecture of a Modern Monitoring System
Chapter Goal: In this chapter we would take a look at the architecture of a modern monitoring system, its components and the integrations. We would look at how to configure a modern monitoring system, how to manage the collected data, run a query on the data, integrations with alerting tools and the reporting of the analysis.
No of pages : 20 Pages
Sub - Topics:
1. Architecture and Components
2. Data management
3. Query Engine
4. Alerting Tools
5. Visualization
Part 2- Open Source Monitoring Tools
Chapter 4: Prometheus
Chapter Goal: This chapter will introduce Prometheus as an open-source monitoring and alerting tool. We will cover the basic concepts, installation and configuration and integration with other tools. We will also look at the use cases which can be delivered with Prometheus and its advantages when compared to Open Source tools like Graphite.
No of pages: 50
Sub - Topics:
1. Introduction to Prometheus
2. Architecture and Data Model
3. Installation and Configuration
4. Instrumenting Prometheus
5. Integrations with other solutions
Chapter 5: TICK Platform
Chapter Goal: We would take a look at Open Source TICK Stack collectively, Telegraf, InfluxDB, Chronograf and Kapacitor. The TICK Stack is a loosely coupled yet tightly integrated set of open source projects designed to handle massive amounts of time-stamped information to support the metrics analysis needs.
No of pages: 50
Sub - Topics:
1. Architecture of TICK Stack
2. Deep Dive into Telegraf
3. Introduction to Influx DB
4. Chronograf and Kapacitor
5. Use cases delivered by Tick Stack
Chapter 6: Elastic Stack – Elastic Search
Chapter Goal: In this chapter we will take a look at the open source Elastic Stack – formerly known as the ELK Stack, to understand the practical application of this tool. We would understand the primary areas where we can use it and how is it different from other tools available in the market today.
No of pages: 50
Sub - Topics:
1. Introduction to Elastic Search, Log Stash and Kibana
2. Architecture and Data Model
3. Installation and Configuration
4. Integrations with other solutions
Part 3- Visualization and Dashboards
Part 3- Visualization and Dashboards
Chapter 7: Analyze and Investigate
Chapter Goal: This chapter is focused on explaining the techniques around choosing the right set of graphs for visualizing your data, specifically time series data. It is important to know the different types, how they work and when to use them. We will also look at how to find a co-relation amongst millions of metrics and arrive at a resolution.
No of pages: 20
Chapter 8: Type of Time Series Graphs
Chapter Goal: This chapter is focused on explaining the techniques around choosing the right set of visualization for your data, specifically time series data. It is important to know the different types, how they work and when to use them.
No of pages: 20
Sub - Topics:
1. Line Graphs
2. Stacked Area Graphs
3. Bar Graphs
4. Heat Maps
Chapter 9: Type of Summary Graphs
Chapter Goal: This chapter will cover summary graphs, which are visualizations that flatten a particular span of time to provide a summary window into your infrastructure. For each graph type, we’ll explain how it works and when to use it. But first, we’ll quickly discuss two concepts that are necessary to understand infrastructure summary graphs: aggregation across time (which you can think of as “time flattening” or “snapshotting”), and aggregation across space.
No of pages: 20
Sub - Topics:
1. Single Value Summaries
2. Toplists
3. Change Graphs
4. Host Maps
5. Distributions
Chapter 10: Graphana
Chapter Goal: In this chapter will take a look at Open Source Grafana tool which allows users to query, visualize, alert on and understand metrics wherever they might be stored. It can integrate with Graphite, Influx DB, Prometheus, AWS CloudWatch etc. as a data source and can act as a single visualization option to help better understand your environment.
No of pages: 50
Part 4 - Acting on the Data
Chapter 11: Alerting and Notifications
Chapter Goal: The chapter is focused on how to start your journey to notifications – set up alerts with a simple click or perform complex anomaly detection based on machine learning algorithms. We will look at sending alerts to popular services like Slack, SMS and PagerDuty. We will also explain using automatic action on alerts through orchestration and how to create custom triggers to perform any action.
No of pages: 20
Sub - Topics:
1. False Alarms2. Notifications
3. Setup integration with alerting tools4. Setup integration with ITSM tools
5. Automated actionsMainak Chakraborty works as a senior solutions architect at a leading public cloud company, specializing in cloud management and automation tools. He has been instrumental in shaping the cloud journey of customers across industry segments whether they be established enterprises or born-in-the-cloud startups. Mainak is an open source enthusiast and regularly presents at industry technical events on his favorite topics of automation, cloud native applications, and cloud computing.
Ajit Pratap Kundan stands at the leading edge of the innovative technologies of todays’ information technology world. He’s worked with HPE, VMware, Novell, Redington, and PCS and helped their customers in transforming their datacenters through software-defined services. Ajit is a valued author on cloud technologies and has authored two books VMware Cross-Cloud Architecture and Intelligent Automation with VMware published by Packt and has reviewed one book Deep Learning with Pytorch.
Introduce yourself to the nuances of modern monitoring for cloud-native applications running on Kubernetes clusters. This book will help you get started with the concepts of monitoring, introduce you to popular open-source monitoring tools, and help with finding the correct set of use cases for their implementation. It covers the in-depth technical details of open-source software used in modern monitoring systems that are tailor made for environments running microservices.
Monitoring Cloud-Native Applications is divided into two parts. Part 1 starts with an introduction to cloud-native applications and the foundational concepts of monitoring. It then walks you through the various aspects of monitoring containerized workloads using Kubernetes as the de-facto orchestration platform. You will dive deep into the architecture of a modern monitoring system and look at its individual components in detail.
Part 2 introduces you to popular open-source tools which are used by enterprises and startups alike and are well established as the tools of choice for industry stalwarts. First off, you will look at Prometheus and understand its architecture and usage. You will also learn about InfluxDB, formerly called TICK Stack (Telegraf, InfluxDB, Chronograf, and Kapacitor). You will explore the technical details of its architecture and the use cases which it solves. In the next chapter, you will be introduced to Grafana, a multi-platform open source analytics and interactive visualization tool that can help you with visualization of data and dashboards.
What You Will Learn
Monitor and observe of metrics, events, logs, and traces
Carry out infrastructure and application monitoring for microservices architecture
Analyze and visualize collected data
Use alerting, reporting, and automated actions for problem resolution
Who This Book Is For
DevOps administrators, cloud administrators, and site reliability engineers (SREs) who manage and monitor applications and cloud infrastructure on a day-to-day basis within their organizations.
1997-2026 DolnySlask.com Agencja Internetowa
KrainaKsiazek.PL - Księgarnia Internetowa


