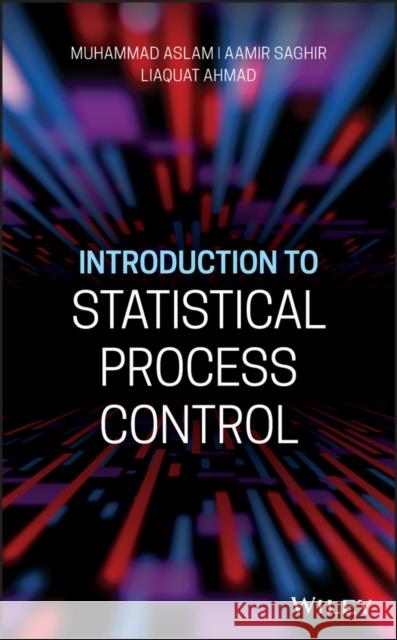
Introduction to Statistical Process Control » książka


Introduction to Statistical Process Control
ISBN-13: 9781119528456 / Angielski / Twarda / 2020 / 304 str.
Introduction to Statistical Process Control
ISBN-13: 9781119528456 / Angielski / Twarda / 2020 / 304 str.
(netto: 471,11 VAT: 5%)
Najniższa cena z 30 dni: 487,62
ok. 30 dni roboczych.
Darmowa dostawa!
About the Authors xiPreface xiiiAcknowledgments xvii1 Introduction and Genesis 11.1 Introduction 11.2 History and Background of Control Charts 31.3 What is Quality and Quality Improvement? 5Types of Quality-Related Costs 71.4 Basic Concepts 91.4.1 Descriptive Statistics 91.4.2 Probability Distributions 14Continuous Probability Distributions 14Discrete Probability Distributions 181.5 Types of Control Charts 191.5.1 Attribute Control Charts 191.5.2 Variable Control Charts 201.6 Meaning of Process Control 21References 222 Shewhart Type Control Charts for Attributes 232.1 Proportion and Number of Nonconforming Charts 242.1.1 Proportion of Nonconforming Chart (p-Chart) 25Variable Sample Size 28Improved p-Chart 292.1.2 Number of Nonconforming Chart (np-Chart) 302.1.3 Performance Evaluation Measures 302.2 Number of Nonconformities and Average Nonconformity Charts 322.2.1 Number of Nonconformities (c-) Chart 332.2.2 Average Nonconformities (u-) Chart 342.2.3 The Performance Evaluation Measure 38Dealing with Low Defect Levels 392.3 Control Charts for Over-Dispersed Data 402.3.1 Dispersion of Counts Data 402.3.2 g-Chart and h-Chart 402.4 Generalized and Flexible Control Charts for Dispersed Data 442.4.1 The gc- and the gu-Charts 452.4.2 Control Chart Based on Generalized Poisson Distribution 46Process Monitoring 47A Geometric Chart to Monitor Parameter theta 482.4.3 The Q- and the T-Charts 49The OC Curve 522.5 Other Recent Developments 52References 543 Variable Control Charts 573.1 Introduction 573.2 x Control Charts 583.2.1 Construction of x and R Charts 593.2.2 Phase II Control Limits 623.2.3 Construction of x Chart for Burr Distribution Under the Repetitive Sampling Scheme 633.3 Range Charts 723.4 Construction of S-Chart 723.4.1 Construction of x Chart 743.4.2 Normal and Non-normal Distributions for x and S-Charts 753.5 Variance S²-Charts 753.5.1 Construction of S²-Chart 763.5.2 The Construction of Variance Chart for Neutrosophic Statistics 773.5.3 The Construction of Variance Chart for Repetitive Sampling 81References 874 Control Chart for Multiple Dependent State Sampling 914.1 Introduction 914.2 Attribute Charts Using MDS Sampling 914.2.1 The np-Control Chart 924.3 Conway-Maxwell-Poisson (COM-Poisson) Distribution 984.4 Variable Charts 1064.5 Control Charts for Non-normal Distributions 1074.6 Control Charts for Exponential Distribution 1094.7 Control Charts for Gamma Distribution 111References 1185 EWMA Control Charts Using Repetitive Group Sampling Scheme 1215.1 Concept of Exponentially Weighted Moving Average (EWMA) Methodology 1215.2 Attraction of EWMA Methodology in Manufacturing Scenario 1265.3 Development of EWMA Control Chart for Monitoring Averages 1275.4 Development of EWMA Control Chart for Repetitive Sampling Scheme 1275.5 EWMA Control Chart for Repetitive Sampling Using Mean Deviation 1285.6 EWMA Control Chart for Sign Statistic Using the Repetitive Sampling Scheme 1395.7 Designing of a Hybrid EWMA (HEWMA) Control Chart Using Repetitive Sampling 147References 1546 Sampling Schemes for Developing Control Charts 1616.1 Single Sampling Scheme 1616.2 Double Sampling Scheme 1626.3 Repetitive Sampling Scheme 1656.3.1 When a Shift of mu1 = mu + ksigma Occurs in the Process 1696.4 Mixed Sampling Scheme 1766.4.1 Mixed Control Chart Using Exponentially Weighted Moving Average (EWMA) Statistics 1796.5 Mixed Control Chart Using Process Capability Index 1806.5.1 Analysis Through Simulation Approach 187References 1877 Memory-Type Control Charts for Attributes 1917.1 Exponentially Weighted Moving Average (EWMA) Control Charts for Attributes 1917.1.1 Binomial EWMA Charts 1927.1.2 Poisson EWMA (PEWMA) Chart 194Performance Evaluation Measure 196Calculation of ARLs Using the Markov Chain Approach 1967.1.3 Other EWMA Charts 202Geometric EWMA Chart 202Conway-Maxwell-Poisson (COM-Poisson) EWMA Chart 2047.2 CUSUM Control Charts for Attributes 2097.2.1 Binomial CUSUM Chart 2107.2.2 Poisson CUSUM Chart 2157.2.3 Geometric CUSUM Chart 2177.2.4 COM-Poisson CUSUM Chart 219Performance Measure 2197.3 Moving Average (MA) Control Charts for Attributes 2207.3.1 Binomial MA Chart 2217.3.2 Poisson MA Chart 2237.3.3 Other MA Charts 225References 2268 Multivariate Control Charts for Attributes 2318.1 Multivariate Shewhart-Type Charts 2318.1.1 Multivariate Binomial Chart 231Choice of Sample Size 2338.1.2 Multivariate Poisson (MP) Chart 2348.1.3 Multivariate Conway-Maxwell-Poisson (COM-Poisson) Chart 2398.2 Multivariate Memory-Type Control Charts 2438.2.1 Multivariate EWMA Charts for Binomial Process 243Design of MEWMA Chart 2448.2.2 Multivariate EWMA Charts for Poisson Process 2458.3 Multivariate Cumulative Sum (CUSUM) Schemes 2468.3.1 Multivariate CUSUM Chart for Poisson Data 247References 248Appendix A: Areas of the Cumulative Standard Normal Distribution 251Appendix B: Factors for Constructing Variable Control Charts 253Index 255
MUHAMMAD ASLAM, Ph.D., is a Professor in the Department of Statistics at King Abdulaziz University at Jeddah, Saudi Arabia. He was awarded the "Research Productivity Award for the year" in 2012 by Pakistan Council for Science and Technology. He is the founder of neutrosophic statistical quality control and neutrosophic inferential statistics.AAMIR SAGHIR, Ph.D., is a Professor in the Department of Mathematics at Mirpur University of Science and Technology. He received his Ph.D. in Statistics from Zhejiang University in China.LIAQUAT AHMAD, Ph.D., is an Associate Professor in the Department of Statistics and Computer Science at the University of Veterinary and Animal Sciences, Lahore, Pakistan. He's taught Statistics for over 24 years at the Ph.D. and M. Phil levels.
1997-2026 DolnySlask.com Agencja Internetowa
KrainaKsiazek.PL - Księgarnia Internetowa


