History of Information Graphics » książka
History of Information Graphics
ISBN-13: 9783836567671 / Angielski / Twarda / 2019 / 462 str.
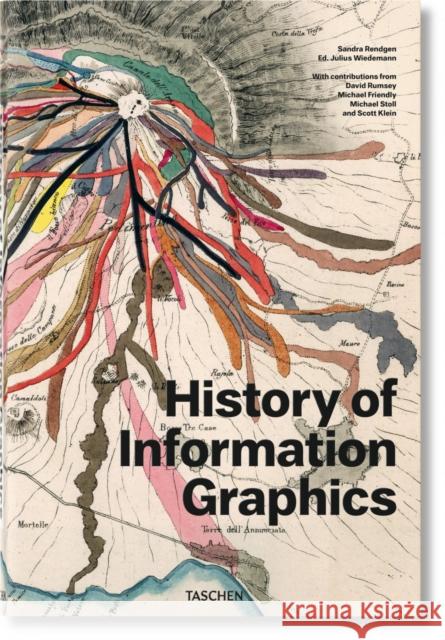
In the age of big data and digital distribution, when news travels ever further and faster and media outlets compete for a fleeting slice of online attention, information graphics have swept center stage. At once nuanced and neat, data graphics can distill abstract ideas, complex statistics, and cutting-edge discoveries into succinct, compelling, and often visually masterful forms, sating our need for speed as much as our omnivorous eye for pleasing design and details. Cartographers, designers, programmers, statisticians, technicians, scientists, and journalists have developed a new field of expertise in visualizing knowledge. This far-reaching compendium looks at the rich history of this infographic form, tracing the evolution of data visualization from the Middle Ages right through to today's infographic phenomenon. Curated by Sandra Rendgen, the author behind TASCHEN's best-selling Information Graphics and Understanding the World, the book offers an at once stunning and systematic overview of graphic communication, gathering some 250 examples across astronomy, cartography, zoology, technology, and beyond. The collection is expansive in culture and geography, as much as reach, incorporating Indian cosmic manuscripts, Japanese world maps alongside German color charts and Da Vinci's Vitruvian Man. Whether an elaborate genealogical tree or a minimalist rendering of data by Bauhaus teacher Herbert Bayer, each featured work is a masterpiece of visual precision and showcases the adaptive reach of information graphics in fields as detailed and diverse as anatomy and airplane engineering. Highlights include Cellarius's cosmic charts, Ernst Haeckel's meticulous nature studies from the 18th and early 19th century, and Buckminster Fuller's Dymaxion map from the 1940s. The infographics are accompanied by precise captions detailing author and historical-cultural contexts as well as a detailed introductory essay.


