Engineering Statistics: An Introduction » książka
Engineering Statistics: An Introduction
ISBN-13: 9783031050091 / Angielski / Twarda / 2022 / 171 str.
Engineering Statistics: An Introduction
ISBN-13: 9783031050091 / Angielski / Twarda / 2022 / 171 str.
(netto: 210,83 VAT: 5%)
Najniższa cena z 30 dni: 192,74
ok. 22 dni roboczych.
Darmowa dostawa!
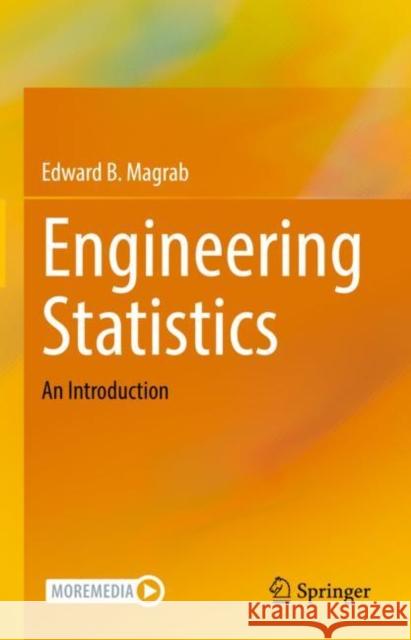
This book presents a concise and focused introduction to engineering statistics, emphasizing topics and concepts that a practicing engineer is mostly likely to use: the display of data, confidence intervals, hypothesis testing, fitting straight lines to data, and designing experiments to find the impact of process changes on a system or its output. It introduces the language of statistics, derives equations with sufficient detail so that there is no mystery as to how they came about, makes extensive use of tables to collect and summarize important formulas and concepts, and utilizes enhanced graphics that are packed with visual information to illustrate the meaning of the equations and their usage. The book can be used as an introduction to the subject, to refresh one’s knowledge of engineering statistics, to complement course materials, as a study guide, and to provide a resource in laboratories where data acquisition and analysis are performed.Created specifically for the book are 16 interactive graphics (IGs) that can be used to replicate all numerical calculations appearing in the book and many of its figures, numerically evaluate all formulas appearing in tables, solve all exercises, and determine probabilities and critical values for commonly used probability distributions. After downloading a free program, the IGs are ready to use and are self-explanatory in the context of the material.
This book presents a concise and focused introduction to engineering statistics, emphasizing topics and concepts that a practicing engineer is mostly likely to use: the display of data, confidence intervals, hypothesis testing, fitting straight lines to data, and designing experiments to find the impact of process changes on a system or its output. It introduces the language of statistics, derives equations with sufficient detail so that there is no mystery as to how they came about, makes extensive use of tables to collect and summarize important formulas and concepts, and utilizes enhanced graphics that are packed with visual information to illustrate the meaning of the equations and their usage. The book can be used as an introduction to the subject, to refresh one’s knowledge of engineering statistics, to complement course materials, as a study guide, and to provide a resource in laboratories where data acquisition and analysis are performed.Created specifically for the book are 16 interactive graphics (IGs) that can be used to replicate all numerical calculations appearing in the book and many of its figures, numerically evaluate all formulas appearing in tables, solve all exercises, and determine probabilities and critical values for commonly used probability distributions. After downloading a free program, the IGs are ready to use and are self-explanatory in the context of the material.


